Oh the Places Your Java Memory Goes
Java heap memory does not make up 100-percent of a JVM process’s memory
allocation. There are many categories of non-heap memory in a JVM process
that often account for more RAM than the heap when they are summed up. It’s possible to set your maximum heap size to 512 MB, -Xmx512m, and have your process consume more than 1 gigabyte of RAM
in total.
If you’re not interested in learning about non-heap categories, you can jump to Suggestions for Improving JVM Memory Use to get some practical tips. But if you read through this post, you’ll learn where your Java process’s memory is going and why. Let’s take a look at these destinations.
JVM Memory Categories
The most significant categories of JVM memory are:
- Heap - The heap is where your Class instantiations or “Objects” are stored.
- Thread stacks - Each thread has its own call stack. The stack stores primitive local variables and object references along with the call stack (list of method invocations) itself. The stack is cleaned up as stack frames move out of context so there is no GC performed here.
- Metaspace - Metaspace stores the Class definitions of your Objects, and some other metadata.
- Code cache - The JIT compiler stores native code it generates in the code cache to improve performance by reusing it.
- Buffer pools - Many libraries and frameworks allocate buffers outside of the heap to improve performance. These buffer pools can be used to share memory between Java code and native code, or map regions of a file into memory.
- OS memory - The operating system keeps heap and stacks for a Java process independent of the heap and stacks managed by the JVM itself. There is also memory consumed for each native library loaded (such as
libjvm.so). This is usually very small.
JConsole and VisualVM can help you inspect some of these categories. But even those tools don’t do a good job of capturing buffer pools, which are some of the sneakiest sources of non-heap memory use. Let’s take a look at an example.
Direct Buffer Pools
Put the following code into a file called Main.java:
import java.nio.ByteBuffer;
import java.util.ArrayList;
import java.util.List;

class Main {
  public static void main(String[] args) throws Exception {
    while (true) {
      List<ByteBuffer> buffers = new ArrayList<>();
      for (int i=0; i < 60; i++) {
        buffers.add(ByteBuffer.allocateDirect(5120000));
      }
    }
  }
}
This creates an infinite loop that allocates a number of direct buffers and then releases them. To run it, execute these commands:
$ javac Main.java
$ java -Xmx512m Main
Leave the process running, and open JConsole by executing jconsole in another terminal. Then connect to the app named “Main”. Click the Memory tab and you’ll see that heap memory is steady (probably well under 20 MB).
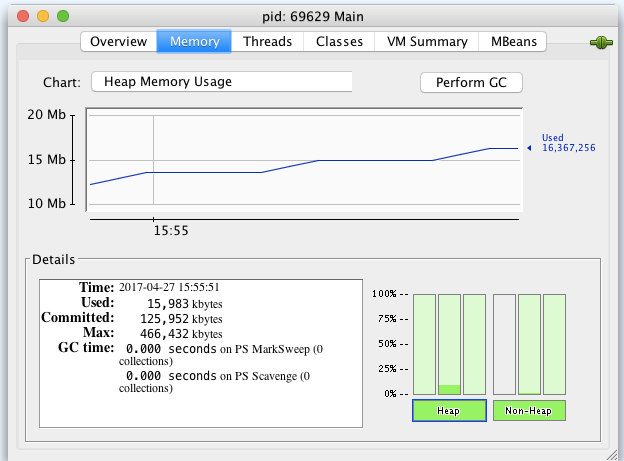
Switch to “Non-heap”, and you’ll see something similar. But if you inspect memory at the operating system level, you’ll get a different picture. On Linux and Mac you can run jps to find the process ID (PID), and then run:
$ top -pid <PID>
The top command will show you the total memory for the Java process in the MEM column, like this:
PID    COMMAND  %CPU  TIME     #TH  #WQ  #POR MEM   PURG CMPR PGRP  PPID
69959  java     133.5 00:14.41 17/1 0    71-  432M+ 0B   0B   69959 11514
The process is actually consuming about 432 MB of RAM! But we don’t see this in JConsole because the calls to ByteBuffer.allocateDirect allocate memory in BufferPools. You can inspect these pools in JConsole by clicking the MBean tab, and then selecting the java.nio.BufferPool MBean named “direct”. You’ll see something like this:
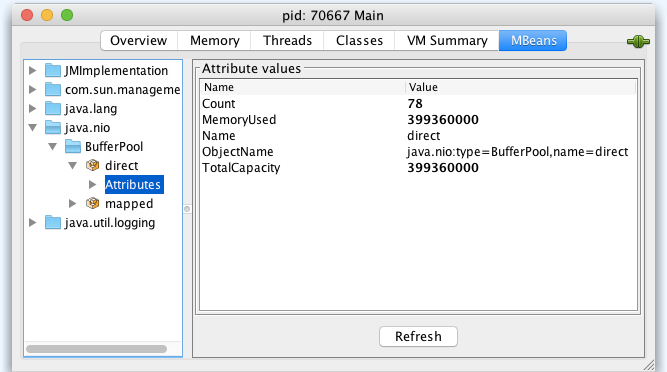
Direct byte buffers are important for improving performance because they allow native code and Java code to share data without copying it. But the allocateDirect method call is expensive, which means byte buffers are usually reused once they’re created. As a result, some frameworks keep them around for the life of the process.
It’s unlikely that you’ll need to use allocateDirect yourself. But it’s very common to use a framework that calls this method. One example is Netty, which is used by popular web frameworks such as Play and Ratpack.
Direct memory is not the only source of hidden JVM memory consumption, though. Another big culprit is Metaspace.
Watching Metaspace
Metaspace contains metadata about the application the JVM is running. It contains class definitions, method definitions, and other information about the program. The more classes you load into your app, the larger metaspace will be.
In older versions of Java, class metadata was stored in the heap, which meant it wasn’t quite so invisible to the average developer. But with the introduction of Metaspace in Java 8, we must be careful to watch it explicitly.
Most Java apps will run with less than 100 MB of metaspace, but alternative JVM languages, like JRuby and Scala, often ballon up to 200 MB. That’s because these languages are essentially very large frameworks. They are loading an entire standard library on top of the Java standard library.
To demonstrate this, start a Scala REPL and execute a few commands in it as shown here (you can install Scala with SDKMAN by running sdk install scala):
$ scala
Welcome to Scala 2.12.1 (Java HotSpot(TM) 64-Bit Server VM, Java 1.8.0_111).
Type in expressions for evaluation. Or try :help.

scala> val abcde = List('a', 'b', 'c', 'd', 'e')
abcde: List[Char] = List(a, b, c, d, e)
Leave the REPL running and execute jconsole in another terminal to open JConsole. Then select the “MainGenericRunner” process and connect to it. Click the Memory tab and choose non-heap memory from the drop-down list. You’ll see the process is already consuming almost 70 MB of non-heap memory.
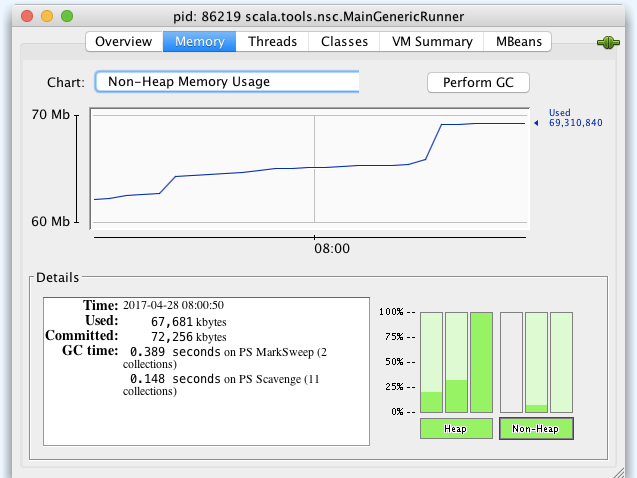
The majority of this memory is consumed by Metaspace (probably 40 to 50 MB), which you can see in VisualVM:
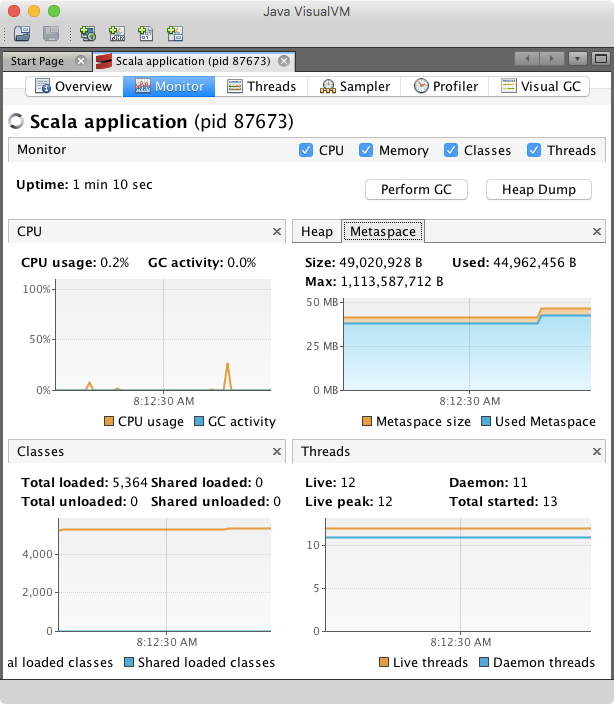
There isn’t usually much you can do in this situation, but you will need to watch out for it to ensure your heap settings leave enough room for metaspace. In some cases, though, you’ll need to breakdown non-heap memory at a fine-grain than VisualVM or JConsole can provide. Fortunately, there are tools for this.
Using Native Memory Tracking
Native Memory Tracking (NMT)
is a JVM feature that tracks internal memory usage. To enable it, add the following options to
the java command you use to run your app:
-XX:NativeMemoryTracking=detail -XX:+UnlockDiagnosticVMOptions -XX:+PrintNMTStatistics
For example, you might run the Main class you created earlier:
$ java -XX:NativeMemoryTracking=detail -XX:+UnlockDiagnosticVMOptions -XX:+PrintNMTStatistics Main
Then grab the PID of the Java process, and use jcmd to print out native memory use for the process:
$ jcmd <PID> VM.native_memory summary
Native Memory Tracking:

Total: reserved=3554519KB, committed=542799KB
-                 Java Heap (reserved=2097152KB, committed=372736KB)
                            (mmap: reserved=2097152KB, committed=372736KB)

-                     Class (reserved=1083039KB, committed=38047KB)
                            (classes #5879)
                            (malloc=5791KB #6512)
                            (mmap: reserved=1077248KB, committed=32256KB)

-                    Thread (reserved=22654KB, committed=22654KB)
                            (thread #23)
                            (stack: reserved=22528KB, committed=22528KB)
                            (malloc=68KB #116)
                            (arena=58KB #44)

-                      Code (reserved=251925KB, committed=15585KB)
                            (malloc=2325KB #3622)
                            (mmap: reserved=249600KB, committed=13260KB)

-                        GC (reserved=82398KB, committed=76426KB)
                            (malloc=5774KB #182)
                            (mmap: reserved=76624KB, committed=70652KB)

-                  Compiler (reserved=139KB, committed=139KB)
                            (malloc=9KB #128)
                            (arena=131KB #3)

-                  Internal (reserved=6127KB, committed=6127KB)
                            (malloc=6095KB #7439)
                            (mmap: reserved=32KB, committed=32KB)

-                    Symbol (reserved=9513KB, committed=9513KB)
                            (malloc=6724KB #60789)
                            (arena=2789KB #1)

-    Native Memory Tracking (reserved=1385KB, committed=1385KB)
                            (malloc=121KB #1921)
                            (tracking overhead=1263KB)

-               Arena Chunk (reserved=186KB, committed=186KB)
                            (malloc=186KB)
The jcmd tool prints detailed allocation information for each category of memory. But it does not capture direct or mapped buffer pools. Metaspace, is represented primarily by the “Class” category.
Usually, the jcmd dump is only moderately useful by itself. It’s more common to take multiple dumps and compare them by running jcmd <PID> VM.native_memory summary.diff.
This is a great tool for debugging memory problems, but it’s not great for passively collecting telemetry on production application. For that, you’ll want to read Memory Logging with the Heroku Java Agent.
Suggestions for Improving JVM Memory Use
The following are some general suggestions for improving the memory footprint of a JVM process:
- Set your maximum thread stack size smaller.
-Xss512kis common, but you can go as low as-Xss256kon a 64-bit JVM. - Look for unclosed IO streams. Make sure that any
InputStreamorOutputStreamobjects are probably closed in afinallyclause. Not doing so can lead to off-heap memory leaks like the one described by Evan Jones of Twitter in Debugging Java Native Memory Leaks. - Set your maximum heap size (
-Xmx) lower. Too many apps are running with a heap that is far bigger than what they need. A heap that is too big can actually hurt performance because, because it causes the GC to take a nap, and then forces it to work overtime when it does run (often causing long pauses). - Tune
glibcby settingMALLOC_ARENA_MAXto a lower value than it’s default, which is 8 times the number of CPU cores. Setting this variable to “2” or “1” results in fewer memory pools and potentially less memory, but this may reduce performance.
For more information, pick up the excellent book Java Performance: The Definitive Guide by Scott Oaks.